Decoding Trends: The Analytics Advantage
1. Unveiling the Power of NLTK in Sentiment Analysis on Twitter Data
In this project, an in-depth sentiment analysis was conducted on a comprehensive Twitter dataset comprising approximately 345,000 tweets related to the 2020 US election. The primary objective was to showcase the pivotal role sentiment analysis can play in predicting public opinion.
Advanced machine learning models, including Support Vector Classification (SVC), were employed to predict the sentiment of tweets with remarkable accuracy. Notably, the results obtained through the implementation of TF-IDF vectorization and SVC classifiers surpassed the performance of alternative models such as Random Forest, Decision Tree, and Naive Bayes. To enhance accessibility, the model was seamlessly hosted as a web application on the PythonAnywhere platform.
The implications of text analysis in predicting public opinion extend across diverse sectors, including politics, marketing, and public relations. Delving into social media data yielded valuable insights into public sentiments surrounding various topics and products. This, in turn, equips organizations and governments with the means to make informed decisions and refine their offerings accordingly.
In summary, this project underscores the efficacy of sentiment analysis utilizing advanced machine learning algorithms applied to Twitter data. The accurate prediction of public opinion empowers organizations to leverage invaluable insights for informed decision-making and continual improvement of products and services. The far-reaching potential of text analysis in predicting public sentiment positions it as a valuable asset across various fields, promising significant positive impacts.
2. Loan Prediction: Analyzing Eligibility Through Machine Learning
The Loan Prediction project seeks to determine the eligibility of a loan application for approval based on specific features, including gender, education, income, credit history, loan amount, loan term, and property area.
Commencing with the import of essential libraries such as pandas, numpy, seaborn, and matplotlib, the project progresses by loading the train and test datasets through the pandas read_csv function. To ensure the integrity of the original data, copies of both datasets are created for subsequent operations and modifications.
Visualizing the target variable, Loan_Status, is executed through a pie chart to comprehend the distribution of loan approval and rejection. Categorical values such as Gender, Married, Dependents, Education, Self_Employed, and Property_Area are further visualized using seaborn countplot.
Subsequently, data preprocessing takes place, addressing missing values and converting categorical data to numerical format through one-hot encoding. The train dataset is then split into train and validation datasets for subsequent model training and evaluation.
Various machine learning algorithms, including logistic regression, decision tree, random forest, and XGBoost, are employed to train the models. Model performance is evaluated using metrics such as accuracy, precision, recall, and F1-score. The best-performing model, determined by these metrics, is then utilized to predict the test dataset.
In conclusion, the Loan Prediction project serves as a classic illustration of binary classification using supervised learning techniques. Offering insights into data exploration, preprocessing, feature engineering, model selection, and evaluation techniques, the project presents a valuable opportunity for learning and application in the domain of predictive analytics.
3. Unveiling Sales Dynamics: Statistical Analysis and Insights
The objective of this project was to conduct hypothesis testing on sales statistics, shedding light on sales performance pre and post the implementation of digital marketing. Additionally, the project aims to ascertain whether there exists any dependency between the features "Region" and "Manager."
The project encompasses two hypotheses:
1.
Null Hypothesis, H0 = "No Increase in Sales" After the introduction of Digital Marketing.Alternate Hypothesis, HA = "Increase in Sales" After the introduction of Digital Marketing.
To test this hypothesis, a two-sample t-test is employed, evaluating the significance of the difference in means between the two datasets. A p-value less than 0.05 indicates rejection of the null hypothesis, signifying a significant increase in sales post the implementation of digital marketing.
2.
H0= There is no dependency between the features “Region” and “Manager”.HA= There is a dependency between the features “Region” and “Manager”.
The Chi-Square test of association is utilized to determine the relationship between these categorical variables. A p-value less than 0.05 results in the rejection of the null hypothesis, indicating a significant dependency between "Region" and "Manager."
Leveraging Python and libraries such as numpy, pandas, matplotlib, seaborn, and scipy, the project calculates statistical values (mean, standard deviation, skewness) and utilizes visualizations (histograms, box plots, scatter plots) to enhance the understanding of the data distribution and variable relationships.
The project's conclusion will offer insights into sales performance pre and post the adoption of digital marketing and assess the dependency between "Region" and "Manager." These findings will empower the company to refine its sales strategies and make informed, data-driven decisions.
4. Precision Forecasting for Retail SuccessIn the dynamic landscape of the retail industry, precise demand forecasting is pivotal for efficient inventory management and ensuring customer satisfaction. This project centers on crafting a robust forecasting system for a retail client, aiming to predict product demand with accuracy based on historical data, ultimately enhancing inventory management strategies.
The project methodology involved sourcing a dataset from Kaggle, encompassing information on product sales across various retail stores. Comprehensive data analysis ensued, encompassing data preprocessing, categorization based on product categories, individual category analysis, and scrutiny for seasonality. Stationarity tests were executed, converting non-stationary series into stationary through differencing. Autocorrelation and partial autocorrelation plots guided the parameter selection for the ARIMA model, with the auto ARIMA function determining the optimal parameters. The model was then fitted, and future sales values were forecasted.
Assumptions were made, presuming data stability from 2012 to 2014 without concealed anomalies. The project's findings and analysis were communicated through charts, tables, and diagrams, offering insights into sales distribution, mean daily sales, and mean monthly sales.
In summary, demand forecasting emerges as a linchpin in the retail sector. By harnessing time series models and scrutinizing historical sales data, this project exemplifies the capacity to make precise predictions, optimizing inventory management, and exceeding customer expectations. It stands as a testament to the impactful synergy of data analysis and forecasting techniques in propelling business success within the dynamic retail landscape.
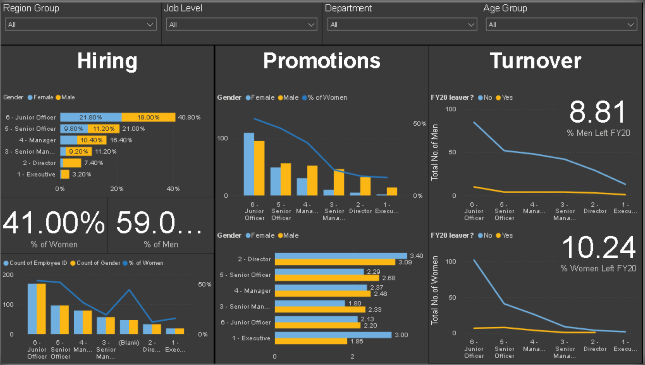
5. Unleashing Business Insights through Power BI VisualizationsIn the contemporary landscape of data-driven enterprises, the significance of business intelligence tools, exemplified by Power BI, cannot be overstated. These tools empower organizations to extract valuable insights from vast datasets, analyze information effectively, and present it in an easily digestible format.
Power BI's user-friendly interface coupled with its robust visualization capabilities accelerates decision-makers' ability to discern trends, patterns, and anomalies, facilitating swift and informed business decisions. The tool's prowess extends to accessing real-time data, enabling organizations to promptly respond to market dynamics, identify opportunities, and optimize overall performance.
As a pivotal instrument in business analytics and decision-making, Power BI plays a critical role in providing organizations with a competitive advantage, fostering growth, and ensuring adaptability to the evolving business landscape.